Welcome!
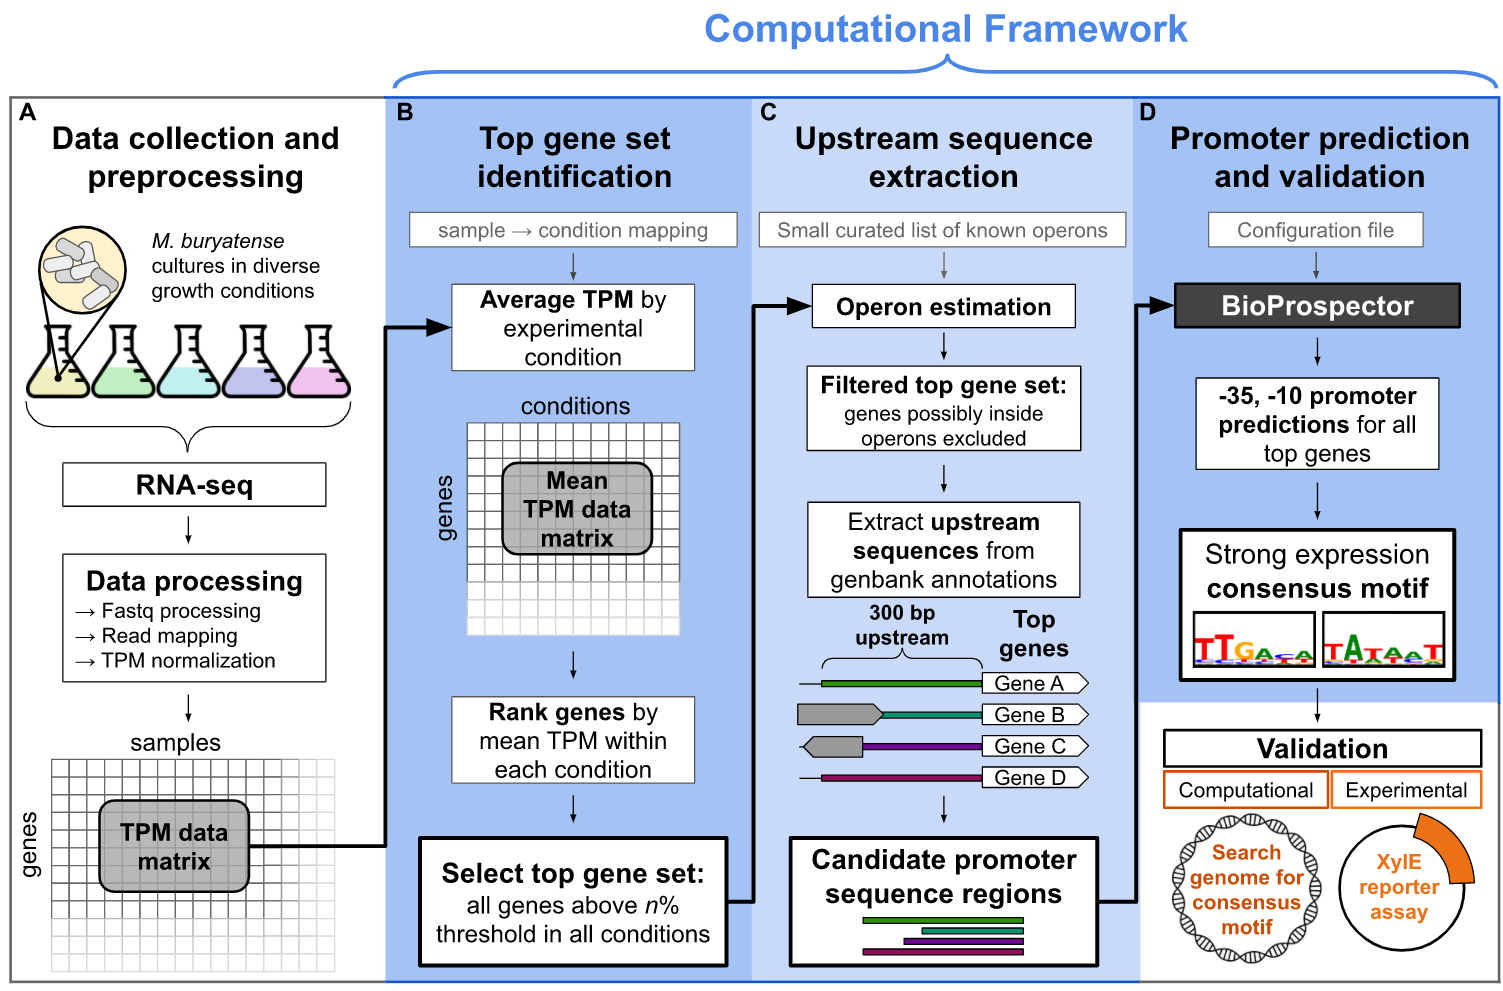
Here you will find further details and resources for exploring data and analysis related to the paper “A computational framework for identifying promoter sequences in non-model organisms using RNA-seq datasets” (published in ACS Synthetic Biology in May 2021). The git repo contains all instructions for running the code but below you will find static html tutorials as well as links to their corresponding Jupyter Notebooks. We’ve also provided a data visualization gallery of interactive plots that we hope will facilitate further exploration and understanding of M. buryatense expression data.
Tutorials
See the following Jupyter Notebooks for tutorials on how various pieces of analysis were carried out:
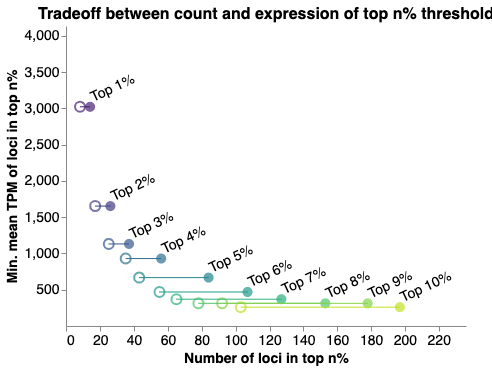
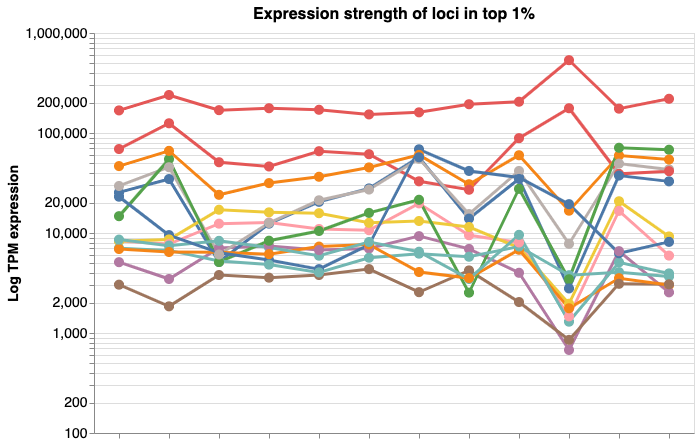
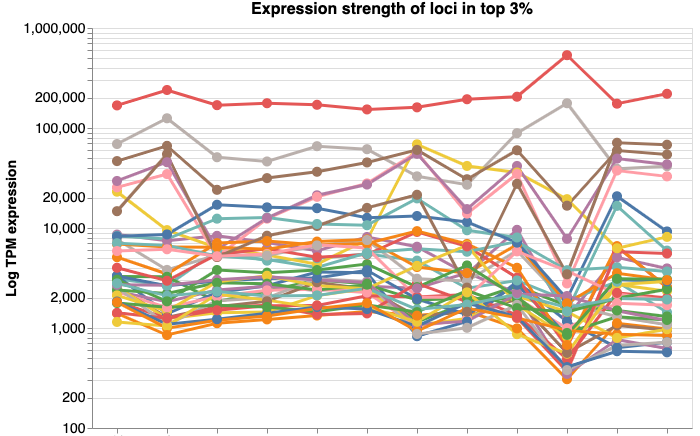
- Exploration of TPM data across conditions
ipynb - Inspection of BioProspector output files
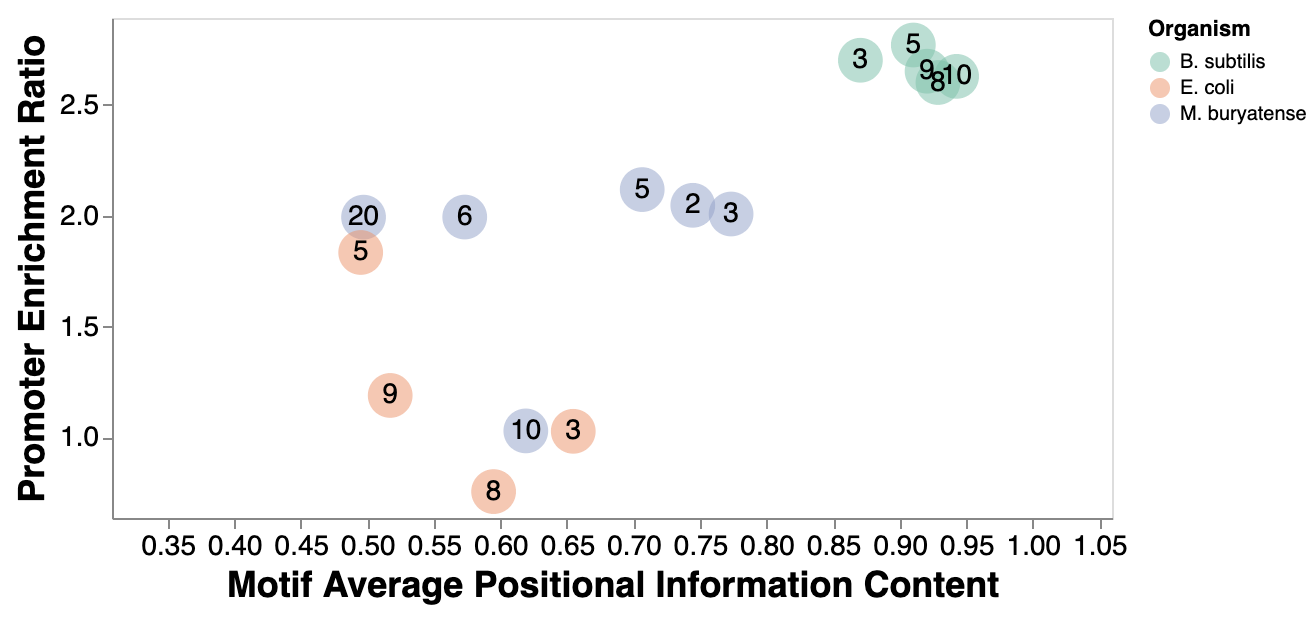
ipynb - Consensus motif analysis
ipynb - Compare consensus predictions across organisms
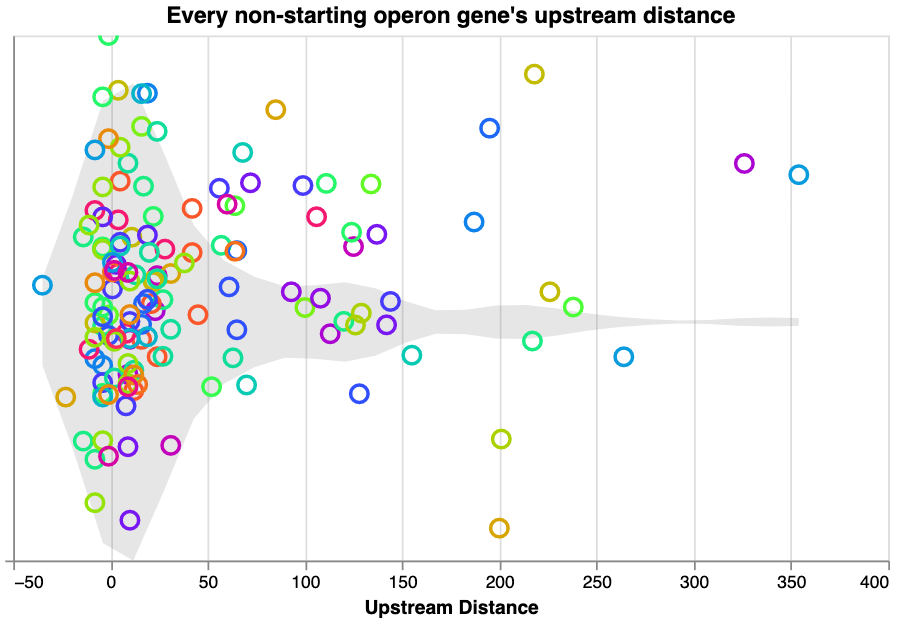
ipynb - Operon distance exploration
ipynb
Interactive Visualizations
Choose an image in the gallery to explore explore data interactively.